
Revenue statistics by customer and number of sales per product
We’ve just introduced new statistics on the dashboard.
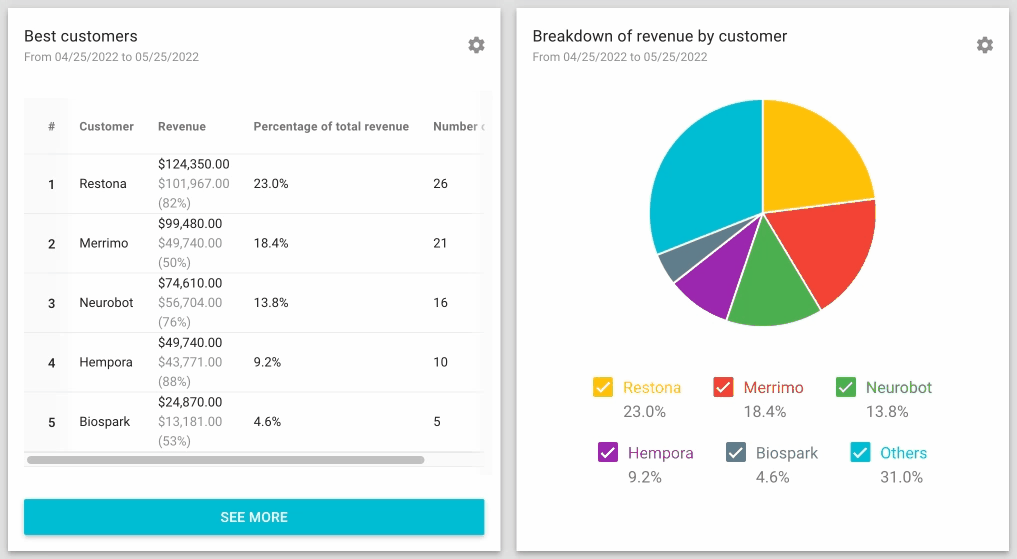
You can now view your five best customers and your five best-selling products.
We’ve also added a pie chart that allows you to identify at a glance where your best customers stand as a percentage of your total revenue.
But that’s not all! To take things even further with statistics, a “See more” button allows you to display all of your best customers or all of your best-selling products. You can then filter the displayed information and export it in CSV format. This feature is ideal if you want to send a targeted newsletter to your X best customers, for example.
Try Toolcie for free
Free plan available. No credit card required. Cancel anytime.

Founder of Toolcie
Clément founded Toolcie in 2018 because he couldn’t find the software he needed. He keeps a close eye on the regulatory changes shaping professional invoicing.
View LinkedIn profileRelated articles


Start your 14-day free trial
Join more than 2,000 professionals who save time every day with Toolcie.
Free plan available. No credit card required. Cancel anytime.